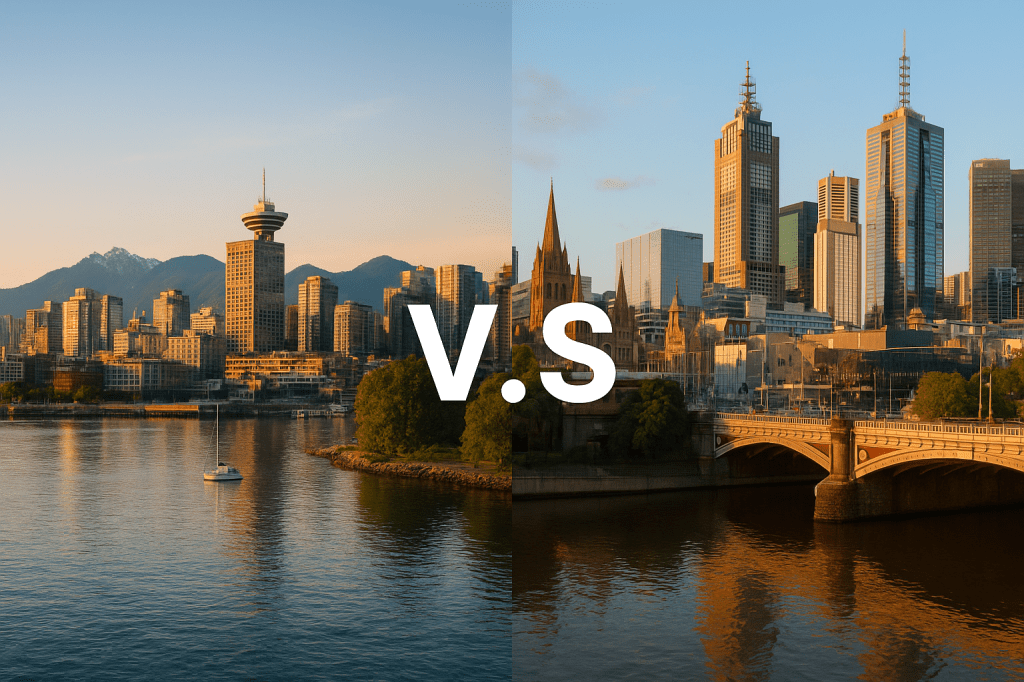
Since moving to Vancouver, one of the biggest professional reality checks has been just how different the the water sector is here compared to what I was used to in Melbourne, Australia. At first glance, the structures appear similar: like Melbourne Water, Metro Vancouver oversees drinking water supply and sewage treatment for the metro area. But beyond that, the similarities fade quickly.
In Melbourne, governance is streamlined. Melbourne Water is a single legal entity, overseen by a board of up to nine appointed directors, with a mandate focused squarely on waterways, sewerage and drainage, and drinking water. Metro Vancouver, by contrast, is a federation of four separate legal entities:
- Greater Vancouver Sewerage & Drainage District (GVS&DD)
- Greater Vancouver Water District (GVWD)
- Metro Vancouver Regional District (MVRD)
- Metro Vancouver Housing Corporation (MVHC)
Together, these bodies extend Metro Vancouver’s remit well beyond water. They regulate air quality, manage regional parks, oversee town planning, and even develop social housing. Each entity has its own board, drawn from elected officials across 19 municipalities. Each of GVWD and GVS&DD boards alone are guided by 37 directors, far more than Melbourne Water’s comparatively lean board structure.
The difference in governance is mirrored at the executive level. Metro Vancouver’s top administrator, Commissioner and Chief Administrative Officer Jerry Dobrovolny, earned a base salary of $451,949 in 2023. This is comparable, though somewhat lower, than Melbourne Water’s Managing Director, Dr. Nerina Di Lorenzo, who received $610,000 in 2023–24. A notable feature of Metro Vancouver’s financial disclosures is its detailed salary reporting, which lists compensation for individual employees, a level of transparency not commonly seen in Australia.
The workforce size also highlights the difference in scope. In 2023, Metro Vancouver employed nearly 2,000 staff, compared to Melbourne Water’s 1,324 full-time equivalent employees. The additional headcount reflects Metro Vancouver’s wider responsibilities beyond core water services.
The scale of water resources under management is another point of contrast. Metro Vancouver supplies 3 million residents from 3 major supply areas with a total storage capacity of 480 gigalitres. Melbourne Water, meanwhile, supplies 5 million residents from 10 major reservoirs holding 1,812 gigalitres, with the security of a desalination plant on standby. Melbourne’s greater storage capacity is no accident, prolonged dry spells and harsher drought conditions have forced the city to plan more aggressively for water security than its Pacific Northwest counterpart.
Wastewater treatment tells a similar story. In 2024, Metro Vancouver treated 465,814 million litres of sewage across its 5 treatment plants. By comparison, Melbourne Water processed 365,867 million litres of sewage in 2023–24, but through only 2 treatment plants located in the east and west of the city. The lower sewage volume in Melbourne, despite its larger population, reflects its relatively successful separation of stormwater and sewer networks, a challenge Vancouver continues to face.
| Entity | Metro Vancouver | Melbourne Water |
| Source | Annual Financial Report 2024 | Annual Report 2023-24 |
| Top executive remuneration | $451,949 | $610,000 |
| No of board members | 37 | 9 |
| No of employees | 1,996 (individuals) | 1,324.34 FTE |
| Storage capacity | 480 gigalitres | 1,812 gigalitres |
| No. of residents served | 3 million | 5 million |
| No. of wastewater treatment plants | 5 | 2 |
| Sewage treated | 465,814 million litres | 365,867 million litres |
Sources:
Metro Vancouver Annual Financial Report 2024
Metro Vancouver 2024 Statement of Financial Statement
